The paper also finds not surprisingly that cold phases are associated with more snow and warm phases with less snow, making a mockery of the claims of Jeff Masters, Mark "death spiral" Serreze, Al Gore and others that warming causes more snowfall.
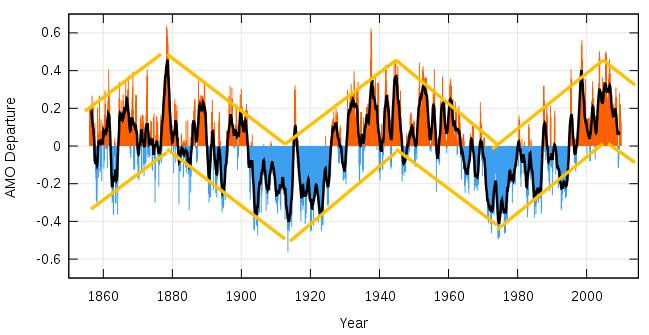 |
| The Atlantic Multidecadal Oscillation (AMO) follows a quasi-60-year cycle |
Decadal variability in snow cover over the Tibetan Plateau during the last two centuries
Key Points
- Coherent variability in ice cores can be considered as a proxy for snow cover
- This proxy for snow cover over the TP exhibits significant decadal variations
- Its variations are highly associated with AMO
Atmospheric Sciences Research Center, State University of New York, Albany, New York, USA
Wei-Chyung Wang
Atmospheric Sciences Research Center, State University of New York, Albany, New York, USA
Gang Zeng
Atmospheric Sciences Research Center, State University of New York, Albany, New York, USA
Based on the coherency in decadal variability between the ice core data and the observed snow cover over the Tibetan Plateau during recent decades, we used three available ice core data to characterize the snow cover variability of the last 200 years. The analysis suggests that the snow cover exhibits significant decadal variability with major shifts around 1840s, 1880s, 1920s, and 1960s. Its variations are found to be closely correlated with the Atlantic Multidecadal Oscillation: Cool/warm phases coincide with large/small snow cover. A plausible mechanism linking the North Atlantic climate to Asian monsoon is presented.
Great catch!
ReplyDeleteYou might be interested in my AMO post titled:
“How the AMO killed the CAGW cult”
http://sbvor.blogspot.com/2010/12/how-amo-killed-cagw-cult.html
I just updated that post to cite this paper.
I added the AMO to my global average info-graphic.
ReplyDeleteI have to take issue with your "13 years and counting".
ReplyDeleteA quick look at http://www.woodfortrees.org/plot/rss/from:1997.4/to:2011.4/trend/plot/rss/from:1997.4/to:2011.4 will show that it should be "14 years and counting"
Thanks Stuart, indeed it is 14 years and counting
ReplyDeleteA simple equation based on the physical phenomena involved, with inputs of accepted measurements from government agencies, calculates the average global temperatures (agt) since 1895 with 88.4% accuracy (87.9% if CO2 is assumed to have no influence). See the equation, links to the source data, an eye-opening graph of the results and how they are derived in the pdfs at http://climaterealists.com/index.php?tid=145&linkbox=true (see especially the pdfs made public on 4/10/10, and 3/10/11).
ReplyDeleteThe future average global temperature trend that this equation calculates is down.
This trend is corroborated by the growing separation between the rising CO2 and not-rising agt. From 2001 through April, 2011 the atmospheric CO2 increased by 21.7% of the total increase from 1800 to 2001 while the average global temperature has not increased. The 21.7% CO2 increase is the significant measurement, not the comparatively brief time period. The trend of the average of the five reporting agencies has declined steeply since the peak of the last El Nino in about March 2010.
Some people are so blinded by ideology that they are unable to recognize reality. However, as the atmospheric CO2 continues to rise in the 21st century while the agt does not, more people will realize that they have been deceived.
Do you have the data to overlay the Satellite Global Temp Anomaly with the El Nino La Nina conditions?
ReplyDeleteI don't have the data for El Nino/La Nina, but I think Bob Tisdale's site probably has this, or the KNMI explorer
ReplyDeleteThis paper is about local conditions, not global. The region of interest is 0.2% of the globe. Warm and cool phases are associated with snowfall (humidity) and the monsoonal cycle. To connect the AMO to global temperatures with this paper is a giant leap too far.
ReplyDeletebarry